Dosya:2005zirconium.PNG

Bu önizlemenin boyutu: 800 × 351 piksel. Diğer çözünürlükler: 320 × 140 piksel | 640 × 281 piksel | 1.425 × 625 piksel.
Orijinal dosya (1.425 × 625 piksel, dosya boyutu: 58 KB, MIME türü: image/png)
Özet
| Açıklama |
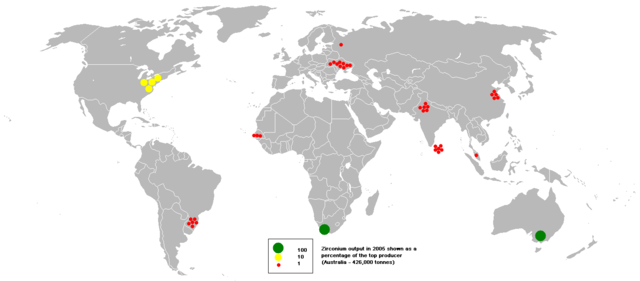
English: This bubble map shows the global distribution of zirconium output in 2005 as a percentage of the top producer (Australia - 426,000 tonnes).
This map is consistent with incomplete set of data too as long as the top producer is known. It resolves the accessibility issues faced by colour-coded maps that may not be properly rendered in old computer screens. Data was extracted on 16th June 2007. Source - http://www.bgs.ac.uk/mineralsuk/commodity/world/home.html (Archived at https://web.archive.org/web/20070809194502/http://www.mineralsuk.com/britmin/wmp_2001_2005.pdf 18:24, 25 January 2016 (UTC)) Based on :Image:BlankMap-World.png |
| Tarih | 16 Haziran 2007 (original upload date) |
| Kaynak | en.wikipedia üzerinden Commons'a Stefan4 tarafından CommonsHelper kullanarak transfer edildi. |
| Yazar | Anwar saadat at İngilizce Vikipedi |
Lisanslama
Anwar saadat at İngilizce Vikipedi, bu işin telif sahibi, burada işi aşağıdaki lisans altında yayımlıyor:
Bu dosya, Creative Commons Atıf-Benzer Paylaşım 3.0 Taşınmamış lisansı ile lisanslanmıştır
Atıf: Anwar saadat at İngilizce Vikipedi
- Şu seçeneklerde özgürsünüz:
- paylaşım – eser paylaşımı, dağıtımı ve iletimi
- içeriği değiştirip uyarlama – eser adaptasyonu
- Aşağıdaki koşullar geçerli olacaktır:
- atıf – Esere yazar veya lisans sahibi tarafından belirtilen (ancak sizi ya da eseri kullanımınızı desteklediklerini ileri sürmeyecek bir) şekilde atıfta bulunmalısınız.
- benzer paylaşım – Maddeyi yeniden karıştırır, dönüştürür veya inşa ederseniz, katkılarınızı orijinal olarak aynı veya uyumlu lisans altında dağıtmanız gerekir.
Orijinal yükleme günlüğü
Dosyanın orjinal açıklama sayfası burada bulunmaktadır. Aşağıdaki tüm kullanıcı adları için en.wikipedia bakın.
- 2007-06-16 13:56 Anwar saadat 1425×625× (59422 bytes)
Dosya geçmişi
Dosyanın herhangi bir zamandaki hâli için ilgili tarih/saat kısmına tıklayın.
| Tarih/Saat | Küçük resim | Boyutlar | Kullanıcı | Yorum | |
|---|---|---|---|---|---|
| güncel | 21.55, 10 Kasım 2011 | | 1.425 × 625 (58 KB) | wikimediacommons>File Upload Bot (Magnus Manske) | {{BotMoveToCommons|en.wikipedia|year={{subst:CURRENTYEAR}}|month={{subst:CURRENTMONTHNAME}}|day={{subst:CURRENTDAY}}}} {{Information |Description={{en|This bubble map shows the global distribution of zirconium |
Dosya kullanımı
Aşağıdaki sayfa bu dosyayı kullanmaktadır: