Dosya:Spectrumgstring.jpg
Daha yüksek çözünürlük yok.
Spectrumgstring.jpg (699 × 477 piksel, dosya boyutu: 57 KB, MIME türü: image/jpeg)
Özet
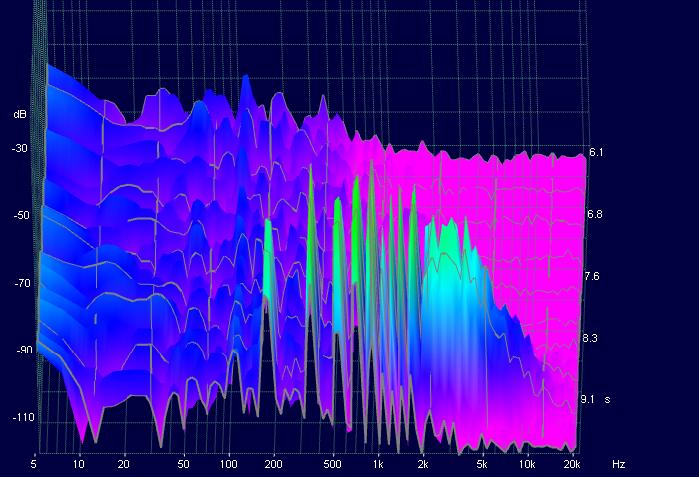
| Açıklama | A 3D sound spectrum analysis of a violin's G String using the OscilloMeter program. x=the frequency of pitch, y=the volume, and z=time. Observe the peaks at the foreground. The other low points are background noise. The interesting thing is that the pitch that we hear is the peak at around 200h, but the other peaks are overtones that contribute to the sound, greatly outnumbering the original pitch. You can make out the overtone series for the note G. |
| Tarih | |
| Kaynak | Yükleyenin kendi çalışması |
| Yazar | Justoys |
Lisanslama
| Ben, bu işin telif sahibi, bu işi kamu malı olarak yayınlıyorum. Bu dünya çapında geçerlidir. Bazı ülkelerde bu yasal olarak mümkün olmayabilir; öyleyse: Ben, bu işi herhangi bir amaç için, herhangi bir şart olmaksızın, yasalarca gerekli olmadıkça, herkesin kullanmasına izin veriyorum. |
Dosya geçmişi
Dosyanın herhangi bir zamandaki hâli için ilgili tarih/saat kısmına tıklayın.
| Tarih/Saat | Küçük resim | Boyutlar | Kullanıcı | Yorum | |
|---|---|---|---|---|---|
| güncel | 20.53, 28 Nisan 2009 | | 699 × 477 (57 KB) | wikimediacommons>Justoys~commonswiki | {{Information |Description=A 3D sound spectrum analysis of a violin's G String using the OscilloMeter program. x=the frequency of pitch, y=the volume, and z=time. Observe the peaks at the foreground. The other low points are background noise. The interest |
Dosya kullanımı
Aşağıdaki sayfa bu dosyayı kullanmaktadır: