Dosya:US Unemployment measures.svg

Bu SVG dosyasının PNG önizlemesinin boyutu: 720 × 540 piksel. Diğer çözünürlükler: 320 × 240 piksel | 640 × 480 piksel | 1.024 × 768 piksel | 1.280 × 960 piksel | 2.560 × 1.920 piksel.
Orijinal dosya (SVG dosyası, sözde 720 × 540 piksel, dosya boyutu: 154 KB)
Özet
| Açıklama |
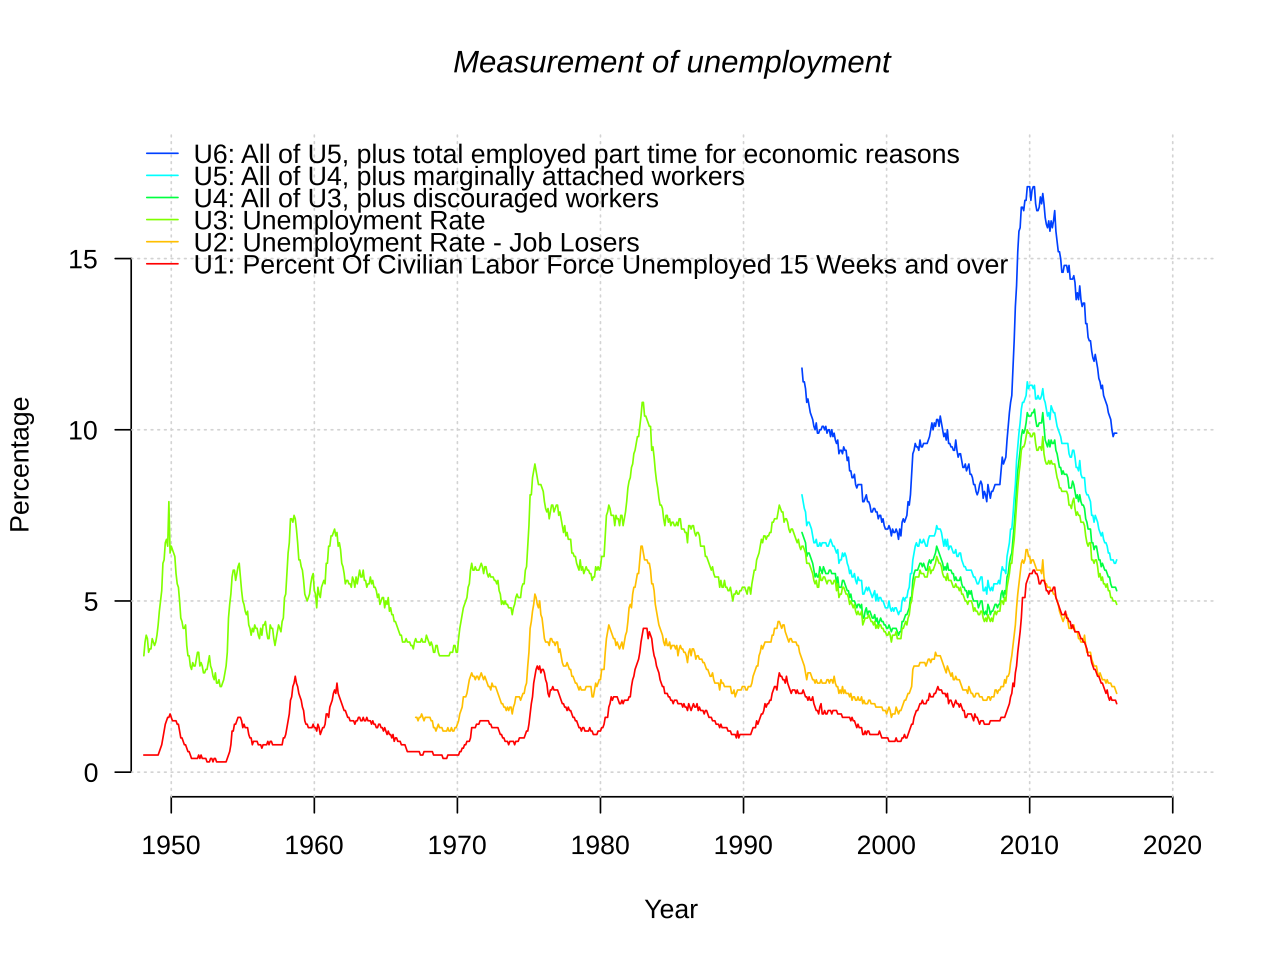
English: Bureau of Labor Statistics measurements U1, U2, U3, U4, U5 and U6. |
| Tarih | |
| Kaynak | Yükleyenin kendi çalışması |
| Yazar | Autopilot |
Source
- data from http://download.bls.gov/pub/time.series/ln/ln.data.1.AllData
- field names from http://download.bls.gov/pub/time.series/ln/ln.series
# parse out just the ones that we care about: U1, U2, U3, U4, U5 and U6
# The AllData file has 4.2 million rows, of which can take some time to
# load, so it is commented out for repeated plots.

if (F) {
	cat("Loading table -- might take some time\n");
	u <- read.table("ln.data.1.Alldata", header=T, fill=T)
	u$time <- u$year + (as.numeric(u$period) - 1) / 12

	cat("Processing -- might take some time\n");
	u1 = subset(u, series_id == "LNS13025670")
	u2 = subset(u, series_id == "LNS14023621")
	u3 = subset(u, series_id == "LNS14000000")
	u4 = subset(u, series_id == "LNS13327707")
	u5 = subset(u, series_id == "LNS13327708")
	u6 = subset(u, series_id == "LNS13327709")
}

par(family="Times")
par(bty = "n")
plot(
	0,
	main = "Measurement of unemployment",
	ylim = c(0,18),
	xlim = c(1950, 2010),
	xlab = "Year",
	ylab = "Percentage",
	las = 1
);

grid()

pal = rainbow(8)
lines(value ~ time, u6, col=pal[6])
lines(value ~ time, u5, col=pal[5])
lines(value ~ time, u4, col=pal[4])
lines(value ~ time, u3, col=pal[3])
lines(value ~ time, u2, col=pal[2])
lines(value ~ time, u1, col=pal[1])

legend(
	"topleft",
	rev(c(
		"U1: Percent Of Civilian Labor Force Unemployed 15 Weeks and over",
		"U2: Unemployment Rate - Job Losers",
		"U3: Unemployment Rate",
		"U4: All of U3, plus discouraged workers",
		"U5: All of U4, plus marginally attached workers",
		"U6: All of U5, plus total employed part time for economic reasons"
	)),
	col = rev(pal[1:6]),
	bty = 'n',
	lty = 1
)

dev.copy(svg, "US Unemployment measures.svg", width=8, height=6)
dev.off()
Lisanslama
Ben, bu işin telif sahibi, burada işi aşağıdaki lisanslar altında yayımlıyorum:
Bu dosya, Creative Commons Atıf-Benzer Paylaşım 3.0 Taşınmamış lisansı ile lisanslanmıştır
- Şu seçeneklerde özgürsünüz:
- paylaşım – eser paylaşımı, dağıtımı ve iletimi
- içeriği değiştirip uyarlama – eser adaptasyonu
- Aşağıdaki koşullar geçerli olacaktır:
- atıf – Esere yazar veya lisans sahibi tarafından belirtilen (ancak sizi ya da eseri kullanımınızı desteklediklerini ileri sürmeyecek bir) şekilde atıfta bulunmalısınız.
- benzer paylaşım – Maddeyi yeniden karıştırır, dönüştürür veya inşa ederseniz, katkılarınızı orijinal olarak aynı veya uyumlu lisans altında dağıtmanız gerekir.

|
Bu belgenin GNU Özgür Belgeleme Lisansı, Sürüm 1.2 veya Özgür Yazılım Vakfı tarafından yayımlanan sonraki herhangi bir sürüm şartları altında bu belgenin kopyalanması, dağıtılması ve/veya değiştirilmesi için izin verilmiştir;
Değişmeyen Bölümler, Ön Kapak Metinleri ve Arka Kapak Metinleri yoktur. Lisansın bir kopyası GNU Özgür Belgeleme Lisansı sayfasında yer almaktadır. |
İstediğiniz lisansı seçebilirsiniz.
Dosya geçmişi
Dosyanın herhangi bir zamandaki hâli için ilgili tarih/saat kısmına tıklayın.
| Tarih/Saat | Küçük resim | Boyutlar | Kullanıcı | Yorum | |
|---|---|---|---|---|---|
| güncel | 08.00, 2 Mart 2016 | | 720 × 540 (154 KB) | wikimediacommons>Kopiersperre | data until 2016.083 |
Dosya kullanımı
Aşağıdaki sayfa bu dosyayı kullanmaktadır: