Dosya:Variance visualisation.svg

Bu SVG dosyasının PNG önizlemesinin boyutu: 375 × 600 piksel. Diğer çözünürlükler: 150 × 240 piksel | 300 × 480 piksel | 480 × 768 piksel | 640 × 1.024 piksel | 1.280 × 2.048 piksel | 512 × 819 piksel.
Orijinal dosya (SVG dosyası, sözde 512 × 819 piksel, dosya boyutu: 5 KB)
Özet
| Açıklama |
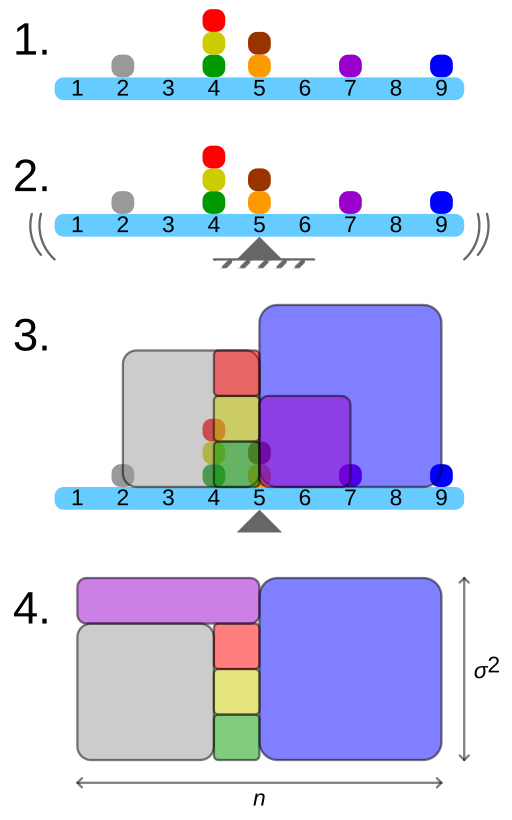
English: Geometric visualisation of the variance of the example distribution (2, 4, 4, 4, 5, 5, 7, 9) on w:Standard deviation.
1. A frequency distribution is constructed. 2. The centroid of the distribution gives its mean. 3. A square with sides equal to the difference of each value from the mean is formed for each value. 4. Arranging the squares into a rectangle with one side equal to the number of values (n) results in the other side being equal to the variance of the distribution (σ²). |
| Kaynak | Yükleyenin kendi çalışması |
| Yazar | Cmglee |
Lisanslama
Ben, bu işin telif sahibi, burada işi aşağıdaki lisanslar altında yayımlıyorum:
Bu dosya, Creative Commons Atıf-Benzer Paylaşım 3.0 Taşınmamış lisansı ile lisanslanmıştır
- Şu seçeneklerde özgürsünüz:
- paylaşım – eser paylaşımı, dağıtımı ve iletimi
- içeriği değiştirip uyarlama – eser adaptasyonu
- Aşağıdaki koşullar geçerli olacaktır:
- atıf – Esere yazar veya lisans sahibi tarafından belirtilen (ancak sizi ya da eseri kullanımınızı desteklediklerini ileri sürmeyecek bir) şekilde atıfta bulunmalısınız.
- benzer paylaşım – Maddeyi yeniden karıştırır, dönüştürür veya inşa ederseniz, katkılarınızı orijinal olarak aynı veya uyumlu lisans altında dağıtmanız gerekir.

|
Bu belgenin GNU Özgür Belgeleme Lisansı, Sürüm 1.2 veya Özgür Yazılım Vakfı tarafından yayımlanan sonraki herhangi bir sürüm şartları altında bu belgenin kopyalanması, dağıtılması ve/veya değiştirilmesi için izin verilmiştir;
Değişmeyen Bölümler, Ön Kapak Metinleri ve Arka Kapak Metinleri yoktur. Lisansın bir kopyası GNU Özgür Belgeleme Lisansı sayfasında yer almaktadır. |
İstediğiniz lisansı seçebilirsiniz.
Dosya geçmişi
Dosyanın herhangi bir zamandaki hâli için ilgili tarih/saat kısmına tıklayın.
| Tarih/Saat | Küçük resim | Boyutlar | Kullanıcı | Yorum | |
|---|---|---|---|---|---|
| güncel | 22.59, 8 Nisan 2015 | | 512 × 819 (5 KB) | wikimediacommons>Cmglee | {{Information |Description ={{en|1=Geometric visualisation of the variance of the example distribution (2, 4, 4, 4, 5, 5, 7, 9) on w:Standard deviation. 1. A frequency distribution is constructed. 2. The centroid of the distribution gives its... |
Dosya kullanımı
Aşağıdaki sayfa bu dosyayı kullanmaktadır: