Dosya:U.S. incarceration rates 1925 onwards.png
Bu önizlemenin boyutu: 800 × 468 piksel. Diğer çözünürlükler: 320 × 187 piksel | 640 × 374 piksel | 1.024 × 599 piksel | 1.280 × 748 piksel | 2.880 × 1.684 piksel.
Orijinal dosya (2.880 × 1.684 piksel, dosya boyutu: 49 KB, MIME türü: image/png)
Özet
| Açıklama |
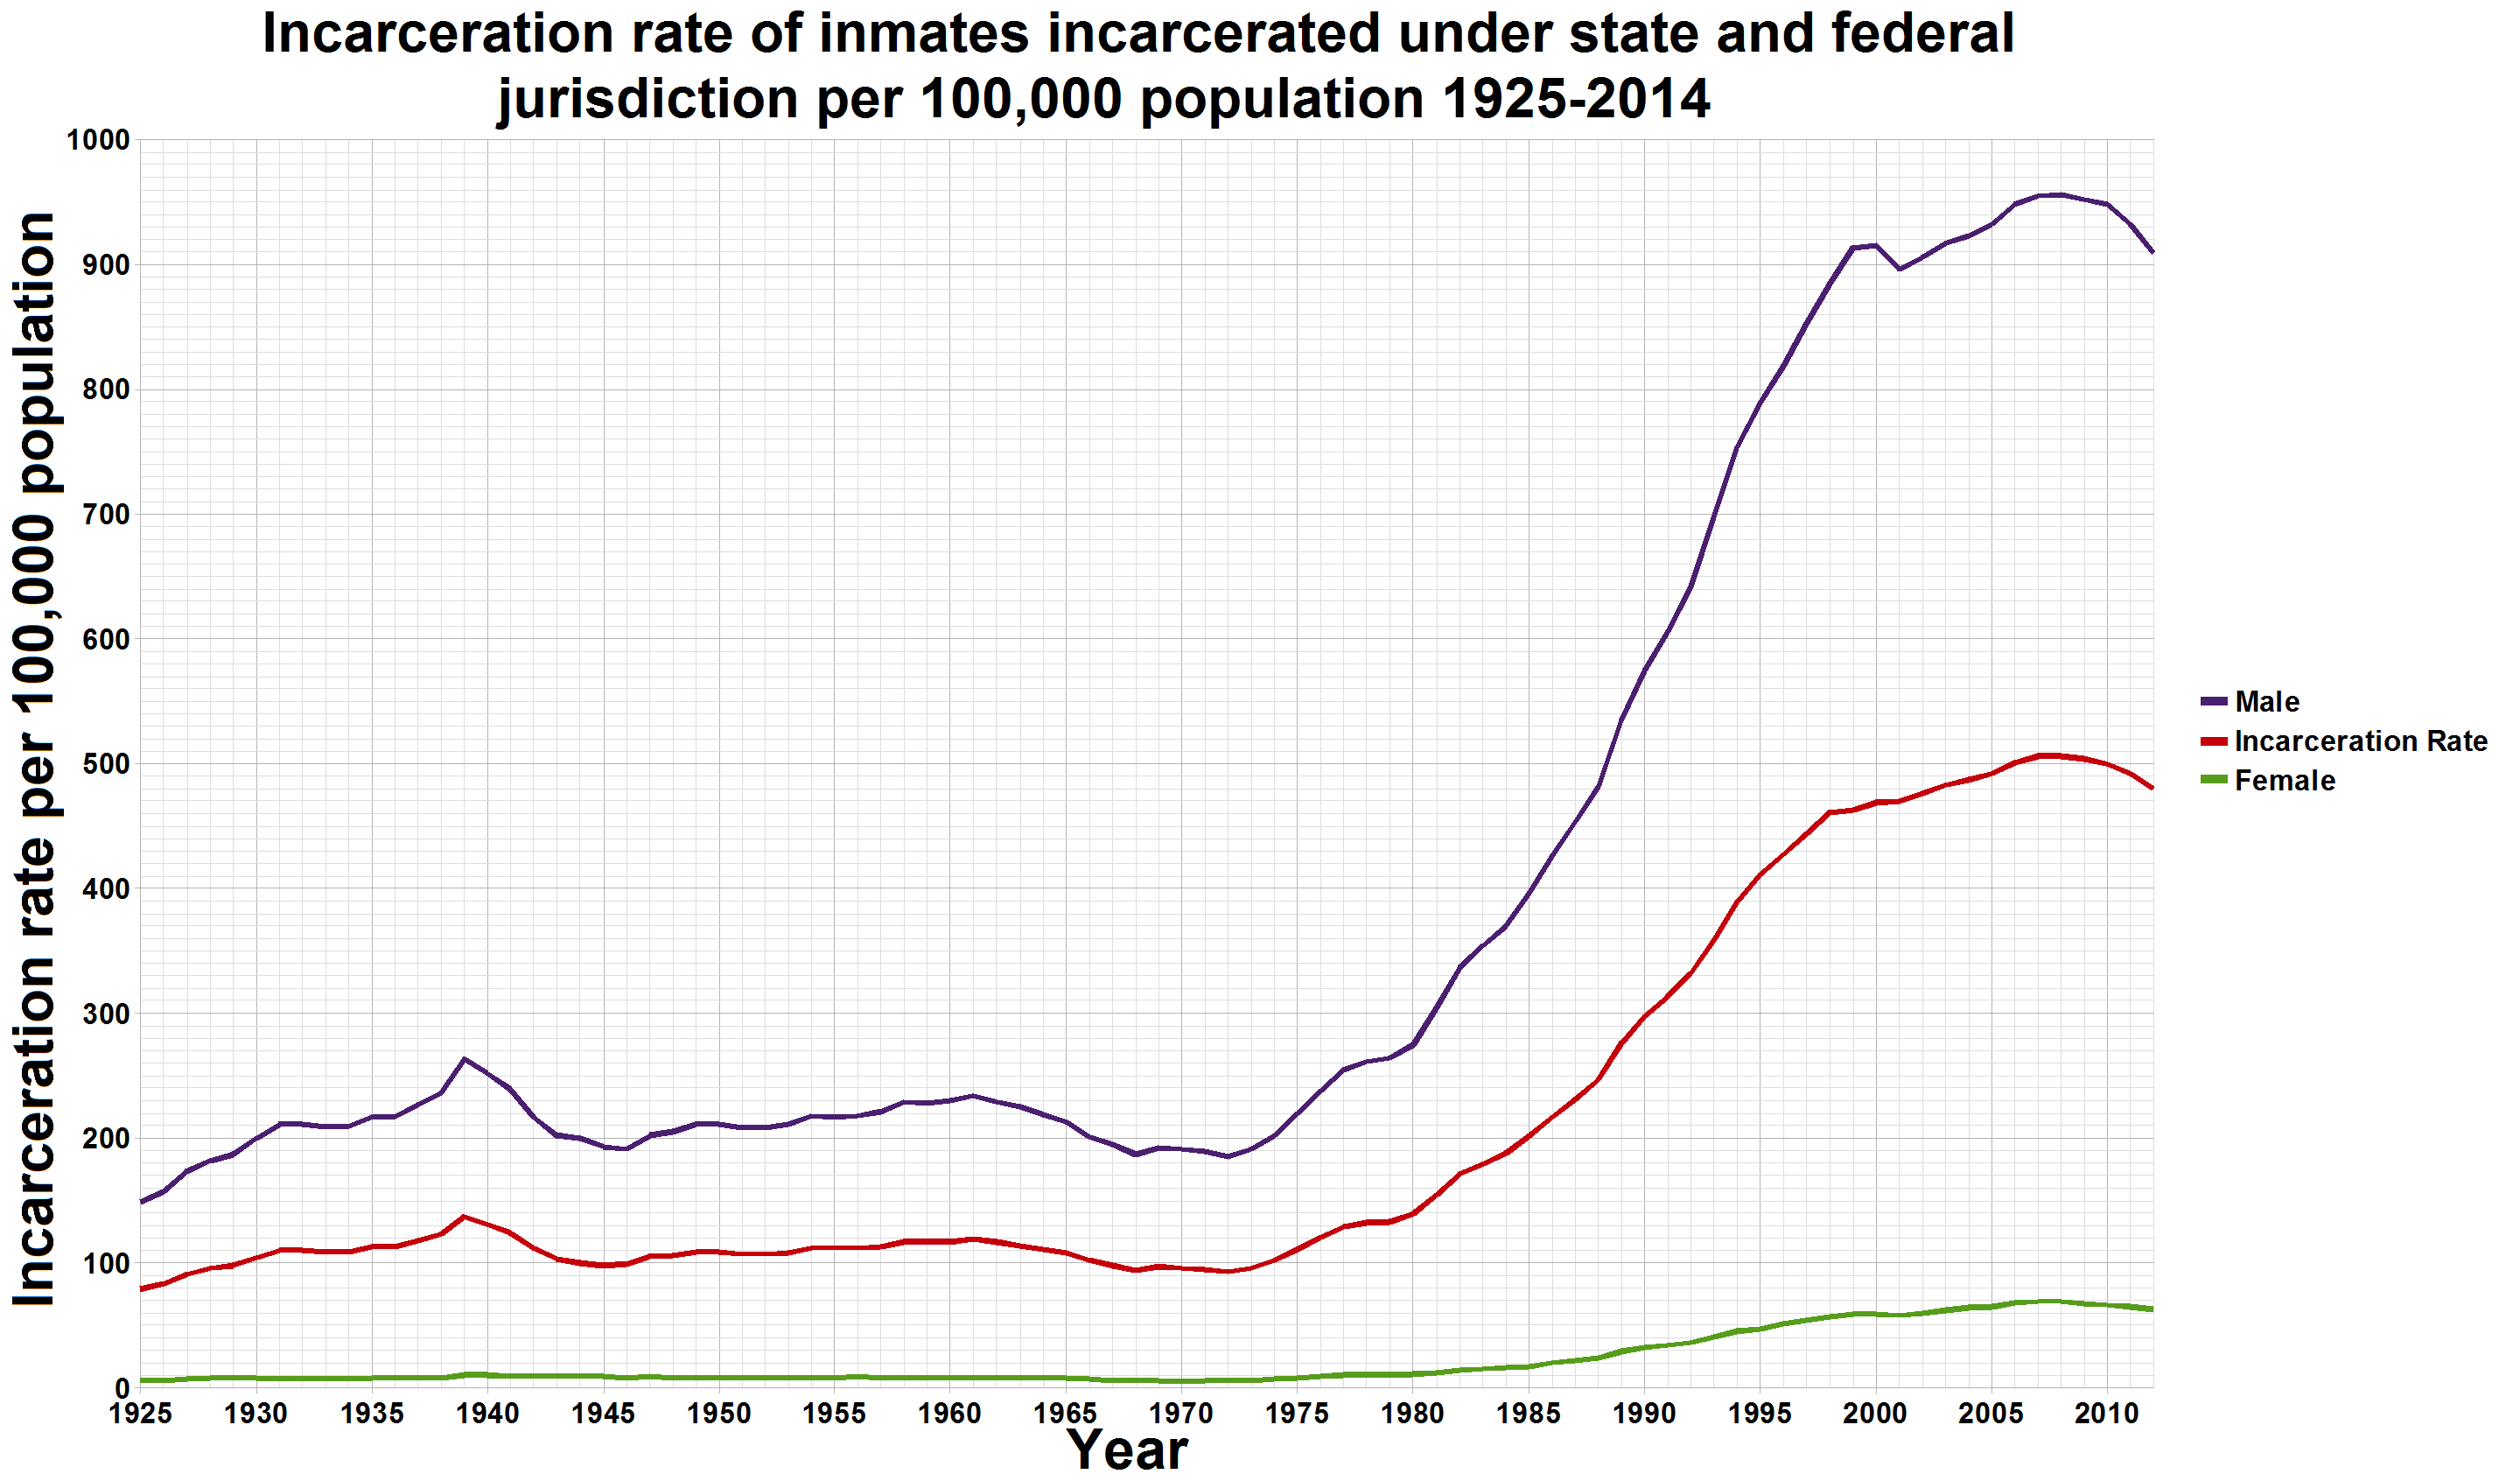
English: A graph made in excel 2007 showing the incarceration rate per 100,000 population in the United States. It shows the female and male rate, as well as their average. The graph depicts the incarceration rate of sentenced prisoners under jurisdiction of State and Federal correctional authorities from 1925 through 2014. It does not include jail inmates. 2003-2013 data from Bureau of Justice (Prisoners in 2013, p13t03.csv and p13t05.csv) |
| Tarih | 5 Ocak 2010 (original upload date) |
| Kaynak | I, Smallman12q (talk), created the graph from the data available at http://bjs.ojp.usdoj.gov/content/glance/tables/incrttab.cfm for the 2003 - 2008 incarceration rate. I used Table 6.28 on page 500 from the "Sourcebook of criminal justice statistics 2003" http://www.albany.edu/sourcebook/pdf/section6.pdf for the rate by sex (gender) for 1925-2008. The sources for that table are as follows: U.S. Department of Justice, Bureau of Justice Statistics, Prisoners1925-81, Bulletin NCJ-85861, p. 2; Prisoners in 1998, Bulletin NCJ 175687, p. 3,Table 3 and p. 5, Table 6; 2000, Bulletin NCJ 188207, p. 5, Table 6; 2001, BulletinNCJ 195189, p. 5 and p. 6, Table 7; 2002, Bulletin NCJ 200248, p. 4 and p. 5, Table5; 2003, Bulletin NCJ 205335, p. 4 (Washington, DC: U.S. Department of Justice);and U.S. Department of Justice, Bureau of Justice Statistics, Correctional Populationsin the United States, 1994, NCJ-160091, Tables 1.8 and 1.9; 1997, NCJ177613, Tables 1.8 and 1.9 (Washington, DC: U.S. Department of Justice). |
| Yazar | Smallman12q (talk) |
| Diğer sürümler | File:U.S. incarceration rate since 1925.svg; en:File:Incarceration rate of inmates incarcerated under state and federal jurisdiction per 100,000 population 1925-2008.pdf. |
The data chart is below. The rates are per 100,000 population of all ages.
| Year | Total | Incarceration Rate |
Male Total |
Male Rate |
Female Total |
Female Rate |
| 1925 | 91,669 | 79 | 88,231 | 149 | 3,438 | 6 |
| 1926 | 97,991 | 83 | 94,287 | 157 | 3,704 | 6 |
| 1927 | 109,983 | 91 | 104,983 | 173 | 4,363 | 7 |
| 1928 | 116,390 | 96 | 111,836 | 182 | 4,554 | 8 |
| 1929 | 120,496 | 98 | 115,876 | 187 | 4,620 | 8 |
| 1930 | 129,453 | 104 | 124,785 | 200 | 4,668 | 8 |
| 1931 | 137,082 | 110 | 132,638 | 211 | 4,444 | 7 |
| 1932 | 137,997 | 110 | 133,573 | 211 | 4,424 | 7 |
| 1933 | 136,810 | 109 | 132,520 | 209 | 4,290 | 7 |
| 1934 | 138,316 | 109 | 133,769 | 209 | 4,547 | 7 |
| 1935 | 144,180 | 113 | 139,278 | 217 | 4,902 | 8 |
| 1936 | 145,038 | 113 | 139,990 | 217 | 5,048 | 8 |
| 1937 | 152,741 | 118 | 147,375 | 227 | 5,366 | 8 |
| 1938 | 160,285 | 123 | 154,826 | 236 | 5,459 | 8 |
| 1939 | 179,818 | 137 | 173,143 | 263 | 6,675 | 10 |
| 1940 | 173,706 | 131 | 167,345 | 252 | 6,361 | 10 |
| 1941 | 165,439 | 124 | 159,228 | 239 | 6,211 | 9 |
| 1942 | 150,384 | 112 | 144,167 | 217 | 6,217 | 9 |
| 1943 | 137,220 | 103 | 131,054 | 202 | 6,166 | 9 |
| 1944 | 132,456 | 100 | 126,350 | 200 | 6,106 | 9 |
| 1945 | 133,649 | 98 | 127,609 | 193 | 6,040 | 9 |
| 1946 | 140,079 | 99 | 134,075 | 191 | 6,004 | 8 |
| 1947 | 151,304 | 105 | 144,961 | 202 | 6,343 | 9 |
| 1948 | 155,977 | 106 | 149,739 | 205 | 6,238 | 8 |
| 1949 | 163,749 | 109 | 157,663 | 211 | 6,086 | 8 |
| 1950 | 166,123 | 109 | 160,309 | 211 | 5,814 | 8 |
| 1951 | 165,680 | 107 | 159,610 | 208 | 6,070 | 8 |
| 1952 | 168,233 | 107 | 161,994 | 208 | 6,239 | 8 |
| 1953 | 173,579 | 108 | 166,909 | 211 | 6,670 | 8 |
| 1954 | 182,901 | 112 | 175,907 | 218 | 6,994 | 8 |
| 1955 | 185,780 | 112 | 178,655 | 217 | 7,125 | 8 |
| 1956 | 189,565 | 112 | 182,190 | 218 | 7,375 | 9 |
| 1957 | 195,414 | 113 | 188,113 | 221 | 7,301 | 8 |
| 1958 | 205,643 | 117 | 198,208 | 229 | 7,435 | 8 |
| 1959 | 208,105 | 117 | 200,469 | 228 | 7,636 | 8 |
| 1960 | 212,953 | 117 | 205,265 | 230 | 7,688 | 8 |
| 1961 | 220,149 | 119 | 212,268 | 234 | 7,881 | 8 |
| 1962 | 218,830 | 117 | 210,823 | 229 | 8,007 | 8 |
| 1963 | 217,283 | 114 | 209,538 | 225 | 7,745 | 8 |
| 1964 | 214,336 | 111 | 206,632 | 219 | 7,704 | 8 |
| 1965 | 210,895 | 108 | 203,327 | 213 | 7,568 | 8 |
| 1966 | 199,654 | 102 | 192,703 | 201 | 6,951 | 7 |
| 1967 | 194,896 | 98 | 188,661 | 195 | 6,235 | 6 |
| 1968 | 187,914 | 94 | 182,102 | 187 | 5,812 | 6 |
| 1969 | 196,007 | 97 | 189,413 | 192 | 6,594 | 6 |
| 1970 | 196,429 | 96 | 190,794 | 191 | 5,635 | 5 |
| 1971 | 198,061 | 95 | 191,732 | 189 | 6,329 | 6 |
| 1972 | 196,092 | 93 | 189,823 | 185 | 6,269 | 6 |
| 1973 | 204,211 | 96 | 197,523 | 191 | 6,004 | 6 |
| 1974 | 218,466 | 102 | 211,077 | 202 | 7,389 | 7 |
| 1975 | 240,593 | 111 | 231,918 | 220 | 8,675 | 8 |
| 1976 | 262,833 | 120 | 252,794 | 238 | 10,039 | 9 |
| 1977 | 285,456 | 129 | 274,244 | 255 | 11,212 | 10 |
| 1978 | 294,396 | 132 | 282,813 | 261 | 11,583 | 10 |
| 1979 | 301,470 | 133 | 289,465 | 264 | 12,005 | 10 |
| 1980 | 315,974 | 139 | 303,643 | 275 | 12,331 | 11 |
| 1981 | 353,673 | 154 | 339,375 | 304 | 14,298 | 12 |
| 1982 | 395,516 | 171 | 379,075 | 337 | 16,441 | 14 |
| 1983 | 419,346 | 179 | 401,870 | 354 | 17,476 | 15 |
| 1984 | 443,398 | 188 | 424,193 | 370 | 19,205 | 16 |
| 1985 | 480,568 | 202 | 459,223 | 397 | 21,345 | 17 |
| 1986 | 522,084 | 217 | 497,540 | 426 | 24,544 | 20 |
| 1987 | 560,812 | 231 | 533,990 | 453 | 26,822 | 22 |
| 1988 | 603,732 | 247 | 573,587 | 482 | 30,145 | 24 |
| 1989 | 680,907 | 276 | 643,643 | 535 | 37,264 | 29 |
| 1990 | 739,980 | 297 | 699,416 | 575 | 40,564 | 32 |
| 1991 | 789,610 | 313 | 745,808 | 606 | 43,802 | 34 |
| 1992 | 846,277 | 332 | 799,776 | 642 | 46,501 | 36 |
| 1993 | 932,074 | 359 | 878,037 | 698 | 54,037 | 41 |
| 1994 | 1,016,691 | 389 | 956,566 | 753 | 60,125 | 45 |
| 1995 | 1,085,022 | 411 | 1,021,059 | 789 | 63,963 | 47 |
| 1996 | 1,137,722 | 427 | 1,068,123 | 819 | 69,599 | 51 |
| 1997 | 1,194,581 | 444 | 1,120,787 | 853 | 73,794 | 54 |
| 1998 | 1,245,402 | 461 | 1,167,802 | 885 | 77,600 | 57 |
| 1999 | 1,304,074 | 463 | 1,221,611 | 913 | 82,463 | 59 |
| 2000 | 1,331,278 | 469 | 1,246,234 | 915 | 85,044 | 59 |
| 2001 | 1,345,217 | 470 | 1,260,033 | 896 | 85,184 | 58 |
| 2002 | 1,380,516 | 476 | 1,291,450 | 906 | 89,066 | 60 |
| 2003 | 1,408,361 | 483 | 1,315,790 | 917 | 92,571 | 62 |
| 2004 | 1,433,728 | 487 | 1,337,730 | 923 | 95,998 | 64 |
| 2005 | 1,462,866 | 492 | 1,364,178 | 932 | 98,688 | 65 |
| 2006 | 1,504,598 | 501 | 1,401,261 | 948 | 103,337 | 68 |
| 2007 | 1,532,851 | 506 | 1,427,088 | 955 | 105,763 | 69 |
| 2008 | 1,547,742 | 506 | 1,441,384 | 956 | 106,358 | 69 |
| 2009 | 1,553,574 | 504 | 1,448,239 | 952 | 105,335 | 67 |
| 2010 | 1,552,669 | 500 | 1,447,766 | 948 | 104,903 | 66 |
| 2011 | 1,538,847 | 492 | 1,435,141 | 932 | 103,706 | 65 |
| 2012 | 1,511,480 | 480 | 1,410,191 | 909 | 101,289 | 63 |
| 2013 | 1,576,950 | 477 | 1,465,592 | 903 | 111,358 | 65 |
| 2014 | 1,561,525 | 471 | 1,448,564 | 890 | 112,961 | 65 |

|
Bu galeride bulunan tüm resimler vektörel grafikler kullanılarak SVG dosyası şeklinde oluşturulmalıdır. Bunun çeşitli avantajları vardır; daha fazla bilgi için Commons:Temizleme medyası sayfasına bakın. Eğer bu resmin SVG formatına sahipseniz, lütfen yükleyin. Lütfen SVG dosyanızı yükledikten sonra, bu şablonu bu resimdeki {{vector version available|yeni resim ismi.svg}} şablonu ile değiştirin.
|
Lisanslama
| Bu iş yazarı Smallman12q at İngilizce Vikipedi tarafından kamu malı olarak yayınlanmıştır. Bu dünya çapında geçerlidir. Bazı ülkelerde bu yasal olarak mümkün olmayabilir; öyleyse: Smallman12q, bu işi herhangi bir amaç için, herhangi bir şart olmaksızın, yasalarca gerekli olmadıkça, herkesin kullanmasına izin veriyor. |
Orijinal yükleme günlüğü
Dosyanın orjinal açıklama sayfası burada bulunmaktadır. Aşağıdaki tüm kullanıcı adları için en.wikipedia bakın.
Upload date | User | Bytes | Dimensions | Comment
- 2010-01-05 17:49:42 | Smallman12q | 29961 | 2882×1674 | {{Information |Description = A graph made in excel showing the incarceration rate per 100,000 population in the United States. It shows the female and male rate, as well as their average. The graph depicts under the rate (per 100,000 resident populati
Dosya geçmişi
Dosyanın herhangi bir zamandaki hâli için ilgili tarih/saat kısmına tıklayın.
| Tarih/Saat | Küçük resim | Boyutlar | Kullanıcı | Yorum | |
|---|---|---|---|---|---|
| güncel | 00.05, 3 Ekim 2016 | | 2.880 × 1.684 (49 KB) | wikimediacommons>Cmdrjameson | Compressed with pngout. Reduced by 132kB (72% decrease). |
Dosya kullanımı
Aşağıdaki 2 sayfa bu dosyayı kullanmaktadır: